
Insights & Data API.
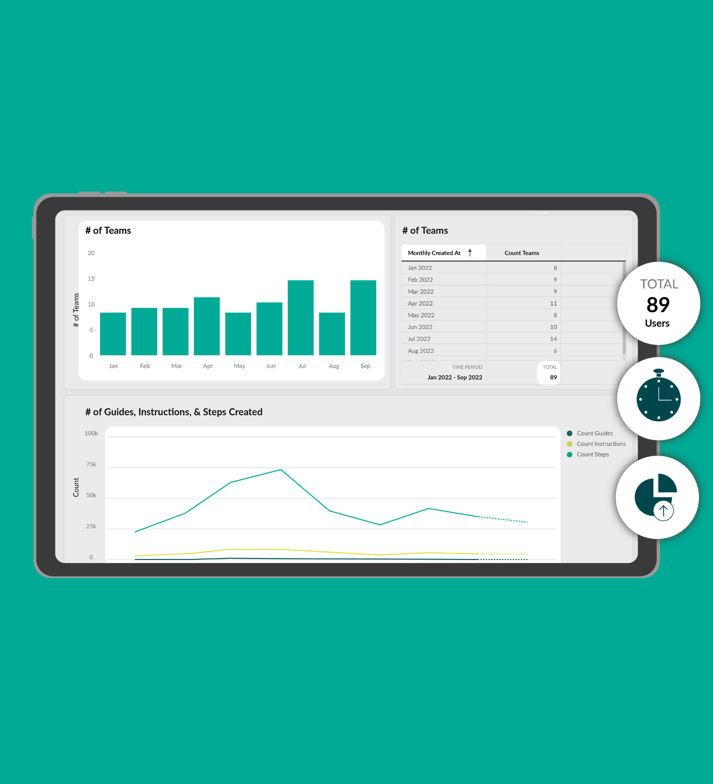
→ Get actionable data and insights on how your SOPs are used across operations. Drill down on usage and adoption while diagnosing areas for improvement. Connect to your data visualization tool or data lake with the SwipeGuide API to uncover patterns, optimize processes, and make data-driven decisions.

What can you measure?
Some of the most common topics to measure:
-
Usage analytics of SOPs and checklists.
-
How work is executed.
-
What feedback is given.
-
Trends based on usage.
-
Differences across operations.
- Anomalies between teams.
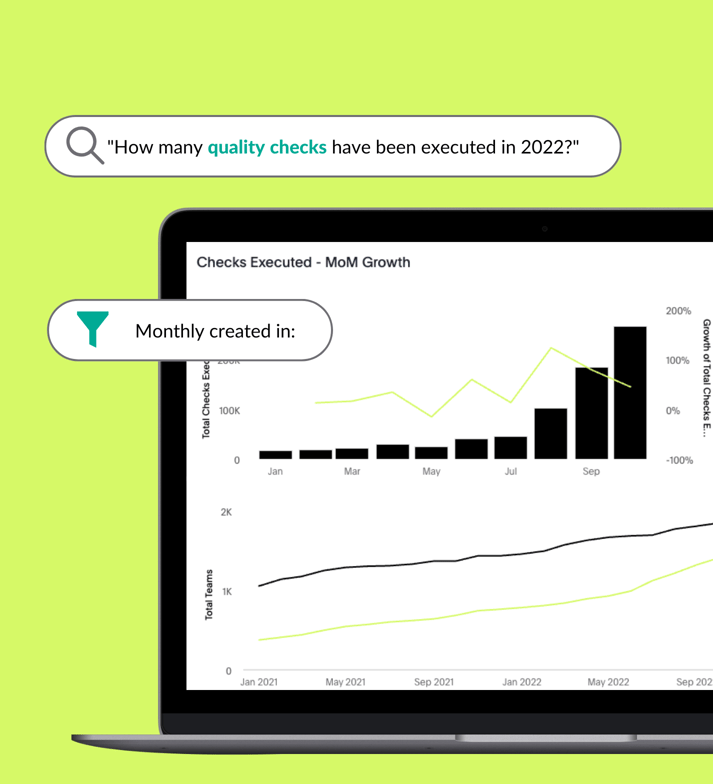
Filter and sort data.
The most popular filter/sort options:
- Date, eg. yesterday
- Content, eg. instruction, checklist
- Workspace, eg. Amsterdam
- Team, eg. Amsterdam maintenance
- Usage, eg. views, sessions
- Status, eg. draft, published
Note: You can analyze data directly in SwipeGuide, but you can also download any of the data from graphs and tables in order to perform further analysis in eg. Power BI, Snowflake, or Tableau.

SwipeGuide Data API.
- Connect SwipeGuide data with other data systems, including Grafana, Power BI, Snowflake, and Tableau.
- Streamline data analysis and visualization in your BI tool.
- Extract relevant data to your data lake (eg. Azure) for custom reporting - or ask us to create a custom report for you.

